Starting a strategy and how a cycle runs
In short
- The strategy buys at the entry, buys more as the price falls and sells the whole amount at the TP.
- The way from the entry to the TP is a cycle; after the TP the next one starts at once.
- Below is one cycle, step by step, with the numbers of an example.
This page follows one cycle from start to finish, using the strategy from the page Creating a strategy. The numbers are calculated by the same rules the system uses. The prices and times in the example are made up.
PriceAveraging levelsTP with fees
The price falls
the strategy buys more, the average price goes down
The price rises to the TP
sells the whole amount — the cycle closes with a profit
A new cycle
starts at once unless "Stop after this cycle" was pressed
A real cycle of a practice strategy: ETH/USDT, the Binance test network, 17 November 2026, 4 parts, a 1 % step, a 0.5 % TP — three averagings and the exit within 8 hours. This is the "buy first" mode; "sell first" and the short are the mirror.
The example strategy
- Connection
binance_main, pair BTCUSDT, spot, strategyanna1. - "Buy first", profit in the quote currency.
- Budget 1000 USDT, 4 parts, step 2 %, each next part larger by 50 %, steps wider by 0 %.
- TP 1 %, market entry.
- Binance fee 0.1 % without the BNB discount. On a buy, Binance takes the fee in the coins bought (BTC); on a sell — in the USDT received.
- Pair rules: quantity step 0.00001 BTC, price step 0.01 USDT, minimum order 5 USDT.
Start the strategy
- Open the strategy on the "Strategies" tab.
- Click "Start".
- Confirm in the window "Start strategy anna1?" with "Start".
First the strategy checks with the exchange: whether there are orders with its number that it does not know, and whether the account has less asset than the strategies of this asset counted together. "Events" shows "checked with the exchange — all agrees". Telegram gets "▶️ Bot started" with the line "The strategy trades by its plan.".
If you clicked "Start" when creating the strategy (the window "Save and start…"), it is already running.
Step 1. The entry
There is no cycle yet, so the strategy builds the grid from the current price of 60,000 and starts cycle 1. Then it buys the first part at market.
| What happened | Numbers |
|---|---|
| Market buy | 0.00205 BTC at 60,000 = 123 USDT |
| Fee | 0.00000205 BTC (0.1 %) |
| The strategy holds | 0.00204795 BTC, cost 123 USDT |
Only after the full entry does the strategy place the next orders:
- DCA1 — buy 0.00313 BTC at 58,800 (2 % below the actual entry price);
- TP — sell 0.00204 BTC at 60,721.39.
The DCA levels are counted from the actual entry price. If the entry filled worse than planned (higher for a buy, lower for a sell) and a level counted from that price came out below the exchange's minimum, the strategy skips it until the cycle ends and places the next one, and Telegram gets "⚠️ DCA level skipped" (see The strategy's rules in detail). In this example every level passes.
The TP price is such that after both fees — the one already paid and the future one — the profit is at least 1 % of the cost. The TP quantity is rounded down to the exchange's step: 0.00000795 BTC stays with the strategy; it is less than the minimum order.
In Telegram:
🟢 Buy filled: entry
anna1 · BTC/USDT · binance_main

Bought: 0.00205 BTC
Price: 60,000.00 USDT
Spent: 123.00 of 1,000.00 USDT

📊 Position
Quantity: 0.00204795 BTC
Cost: 123.00 USDT
Average price: 60,000.00 USDT
Break-even: 60,120.19 USDT

🎯 Planned TP: 60,721.39 USDT

Nothing to do.
First the trade: how much was bought and at what price; "Spent" is how much has been bought in this cycle so far (at the trades' prices, before fees — as the grid is sized) out of the whole budget. The "Position" is what the strategy holds after the trade: the quantity is smaller than bought by the fee in BTC. "Average price" is by the prices of the trades, without fees, as the exchange shows it. "Break-even" is the price with the fees: selling the whole position at it returns the cost. "Planned TP" is the price of the TP the strategy places after this trade. Numbers are in the language's format: a decimal point and a comma between thousands. The last line of every message says what to do; here — "Nothing to do.".
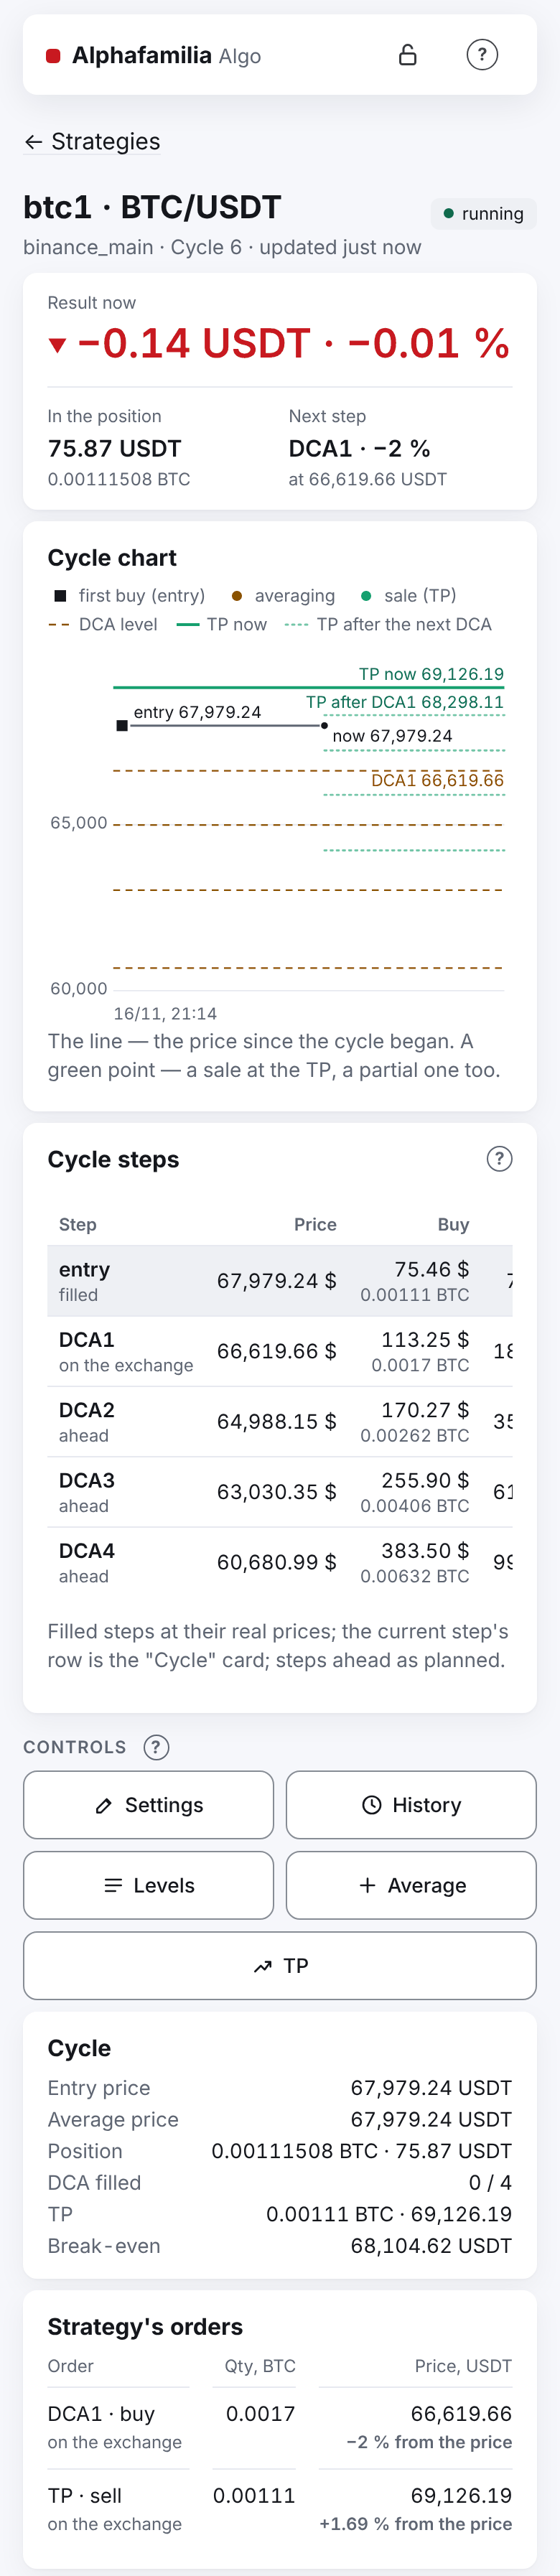
In the app, on the strategy's screen, in the "Cycle" card:
| Field | Value |
|---|---|
| Entry price | 60,000.00 USDT |
| Average price | 60,000.00 USDT |
| Position | 0.00204795 BTC · 123.00 USDT |
| DCA filled | 0 / 3 |
| TP | 0.00204 BTC @ 60,721.39 |
| Break-even | 60,120.19 USDT |
The numbers on the screen are as in the Telegram messages: amounts in USDT, USDC and roubles have two decimals, a coin's quantity is exact, prices go to the pair's price step. A value shown rounded can be tapped (on a computer it gets a dotted underline when the pointer is over it) to see the exact one (for example, after an averaging — "59,274.9035 USDT"), tap again to get the rounded one back.
The "Average price" is the average of the purchases by their prices, without fees: the same number on the strategy's screen, in the manual control, in the messages and on the exchange. The fees are in "Break-even" — the price at which selling the whole position, fee included, returns the cost; it is above the average because the fee took part of the coins bought and one more is charged at the sale. "Result now" is what such a sale would give at the current price (also in % of the budget, as a cycle's result); right after the entry it is a little below zero because of the fees.
The "Strategy's orders" card shows DCA1 and the TP marked "on the exchange".
Step 2. The price falls: DCA1 fills
The price reached 58,800, DCA1 filled.
| What happened | Numbers |
|---|---|
| DCA1 buy | 0.00313 BTC at 58,800 = 184.044 USDT |
| Fee | 0.00000313 BTC |
| The strategy holds | 0.00517482 BTC, cost 307.044 USDT |
| Average price | 59,274.9035 (without fees); the cost of one coin — 59,334.2377 |
The strategy recalculates the TP from the new average price and places the next level:
- It cancels the old TP (60,721.39) and waits until the exchange confirms the cancel.
- It places DCA2 — buy 0.00480 BTC at 57,600.
- It places a new TP for the whole amount — sell 0.00517 BTC at 59,987.57.
The new TP is lower than the old one: the average price became lower. There are never two TPs at once: the new TP appears only after the old one's cancel is confirmed, usually in a few seconds.
In Telegram:
🟢 Buy filled: DCA1 of 3
anna1 · BTC/USDT · binance_main

Bought: 0.00313 BTC
Price: 58,800.00 USDT
Spent: 307.04 of 1,000.00 USDT

📊 Position
Quantity: 0.00517482 BTC
Cost: 307.04 USDT
Average price: 59,274.90 USDT
Break-even: 59,393.64 USDT

🎯 Planned TP: 59,987.57 USDT

Nothing to do.
"DCA1 of 3" is the first of three averagings. The "Planned TP" is the new one already, from the new average price.
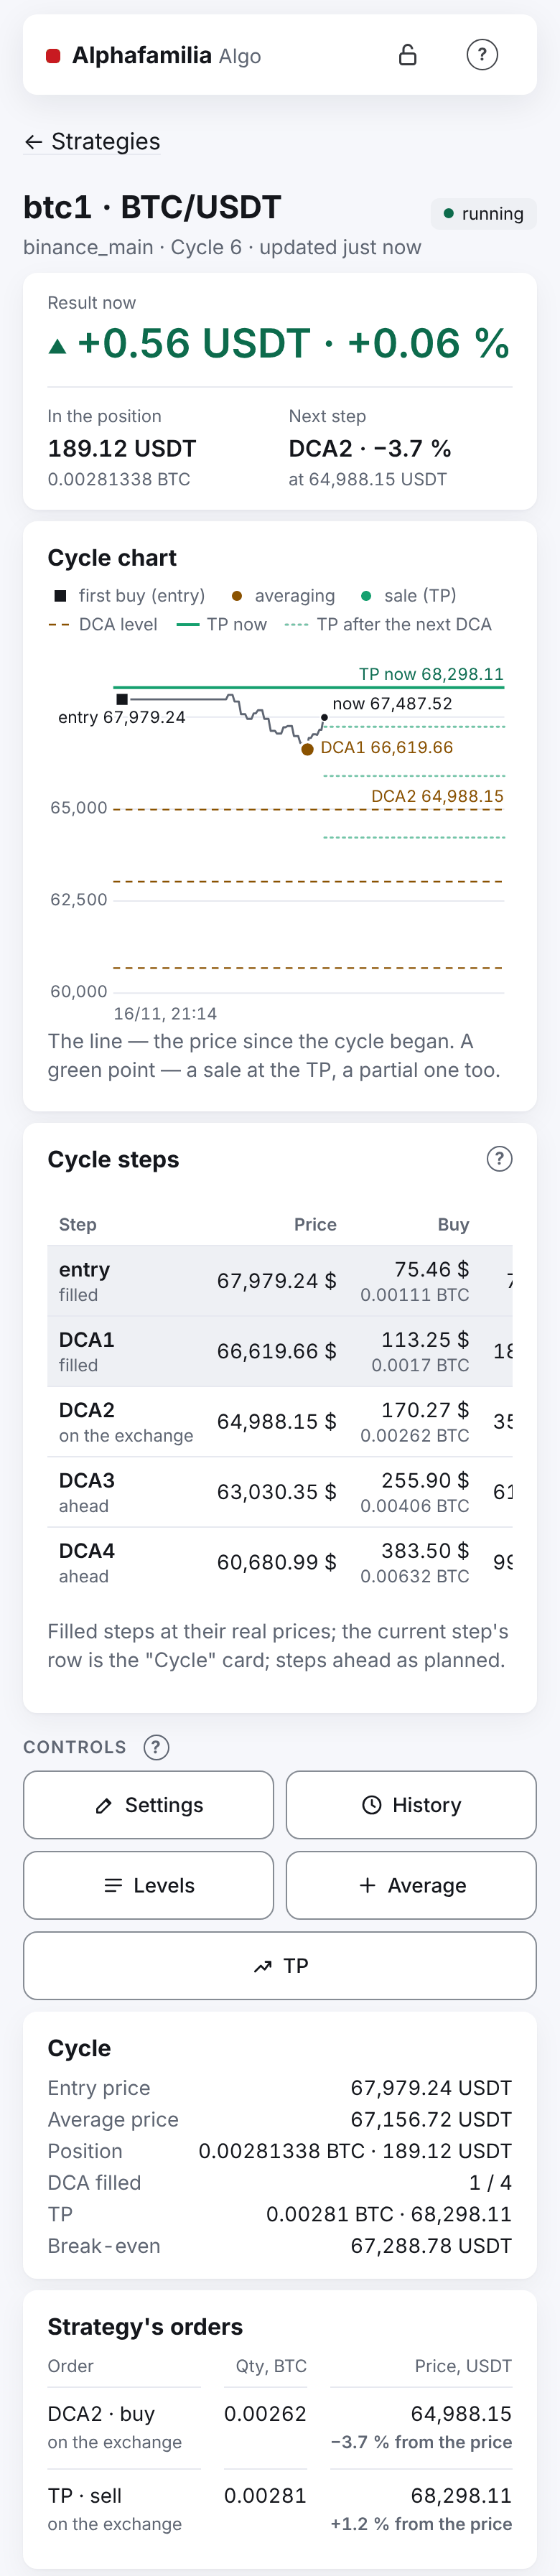
In the app: "Average price" 59,274.90 USDT (exactly — 59,274.9035), "Position" 0.00517482 BTC · 307.04 USDT, "DCA filled" 1 / 3, "TP" 0.00517 BTC @ 59,987.57, "Break-even" 59,393.64 USDT. "Events" shows the DCA1 fill, the cancel of the old TP and the new orders.
The cycle chart
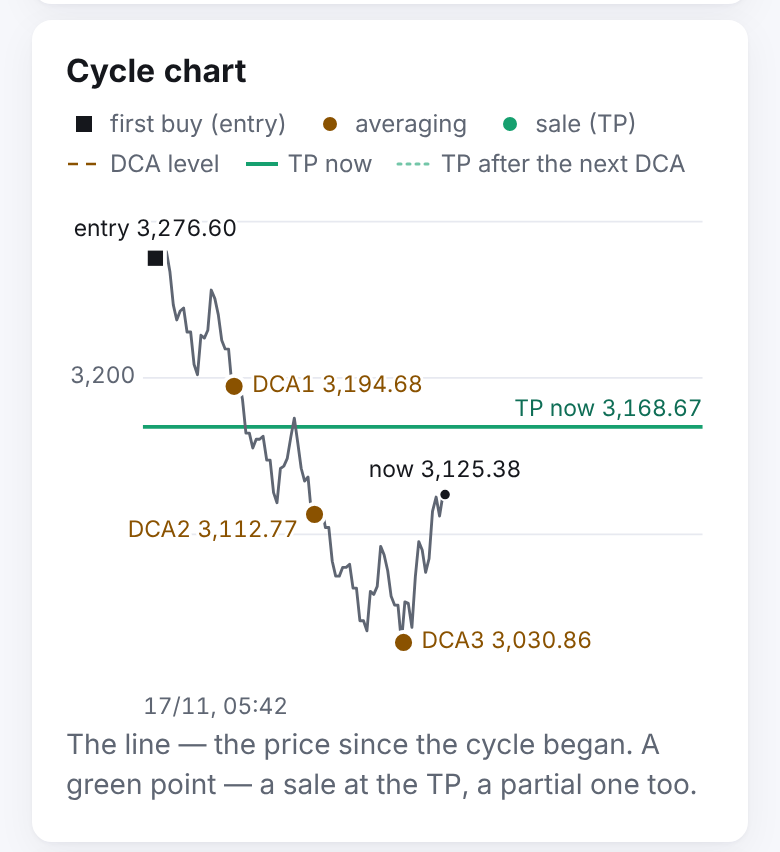
Right under what matters most ("Result now", "In the position", "Next step"), above the "Controls" block and the "Cycle" card, — the "Cycle chart": what the price did since the current cycle began and what the strategy does next. Above the chart — the legend, under it — a hint.
- The grey line is the pair's price from the cycle's start (its time is at the bottom left) to "now", from the exchange's candles and through the prices of the cycle's trades: the dot of the entry and of each averaging always lies on the line, even when the averaging filled inside a candle at its low; the dot at its end is the current price, labelled "now 130.64". For a paused or stopped strategy "now" is the last candle's close (no extra request).
- The dots are the cycle's trades at their time and price: the first buy (the entry) a square in the colour of the text ("entry 134.09"), the averagings (DCA and manual) yellow dots ("DCA1 131.41"), a sale (a TP fill, partial or the one that closes the cycle) green ("sale 134.21"). A "sell first" strategy and a futures short have their own words, the colours and shapes the same: the entry is the "first sale (entry)", a TP fill a "buy-back (TP)" ("buy-back 128.40"); its DCA levels and "TP after…" are above the entry, the "TP now" below. Trades whose dots lie on one another on the chart (say, the entry and two averagings within seconds on a fine grid) share one label: the first and the last step and their prices — "entry–DCA2 1,757.34–1,760.86"; the parts of one order are one step, and if they filled at different prices — with their range: "DCA1 110.80–112.00".
- Yellow dashed lines labelled on the right "DCA2 128.73"… are the averaging levels still to come. A manual limit order ("Average") placed but not filled yet is the same dashed line labelled "manual 130": the strategy keeps it on the exchange together with the next DCA level, and the one the price reaches first fills first.
- The solid green line "TP now 134.21" is the TP that stands now.
- The right part of the chart is "the future": pale green dotted lines "TP after DCA2 132.86", "after DCA3 131.50"… are where the strategy moves the TP once that averaging (and every one before it) fills; after the manual order — "after manual 131.95". The strategy counts them as it places its TP itself: with the larger of the two fees — its own and the exchange's — for the exit, and with a broker's fee not charged yet. The fee of the trades to come is the one the exchange actually charged on this cycle's trades (the same share, in the same asset — e.g. in BTC on Binance); until it has been charged once — the planned one. So when a level fills at its price with the same fee, the strategy places exactly this TP; if the fee changes, so does the TP.
- On the left — grey gridlines (usually three or four) with round prices.
Every line has its price. A label stands above its line, below it or at its other end, and never lies on the price line, a level or the TP, nor on another label; when there is no room, the less important one is left out; "TP now" and "now" are always shown. The chart shows up to six nearest DCA levels (the manual order always); if there are more levels, a line under it says how many are further: "Further DCA levels: 3." The price is asked of the exchange only while the strategy's screen is open, at most once a minute (several open screens of strategies of one connection and pair get one answer), and last of all — it never gets in the way of the strategies' orders. If the exchange did not answer, the levels are drawn anyway, with one line under the chart: "The exchange gave no price history — the chart shows the levels only." No cycle (the strategy is between cycles or not loaded) — no chart. T-Invest has candles only while the exchange trades: a night or a weekend is a straight segment of the line.
A strategy paused, stopped or in emergency in the middle of a cycle has its chart: the levels and the TP on it are the cycle's plan, as if the strategy ran, with a short grey line above the chart: "The strategy is paused — the levels and the TP are shown as planned.", "The strategy is stopped — …", "Emergency, the strategy is stopped — …". When paused, "TP now" is the one on the exchange. A stopped strategy has no TP on the exchange, and "TP now" is the one the strategy places if the cycle is continued. "Stop" takes the manual order off for good — it is no longer on the chart; on "Pause" it stays and is shown.
Cycle steps
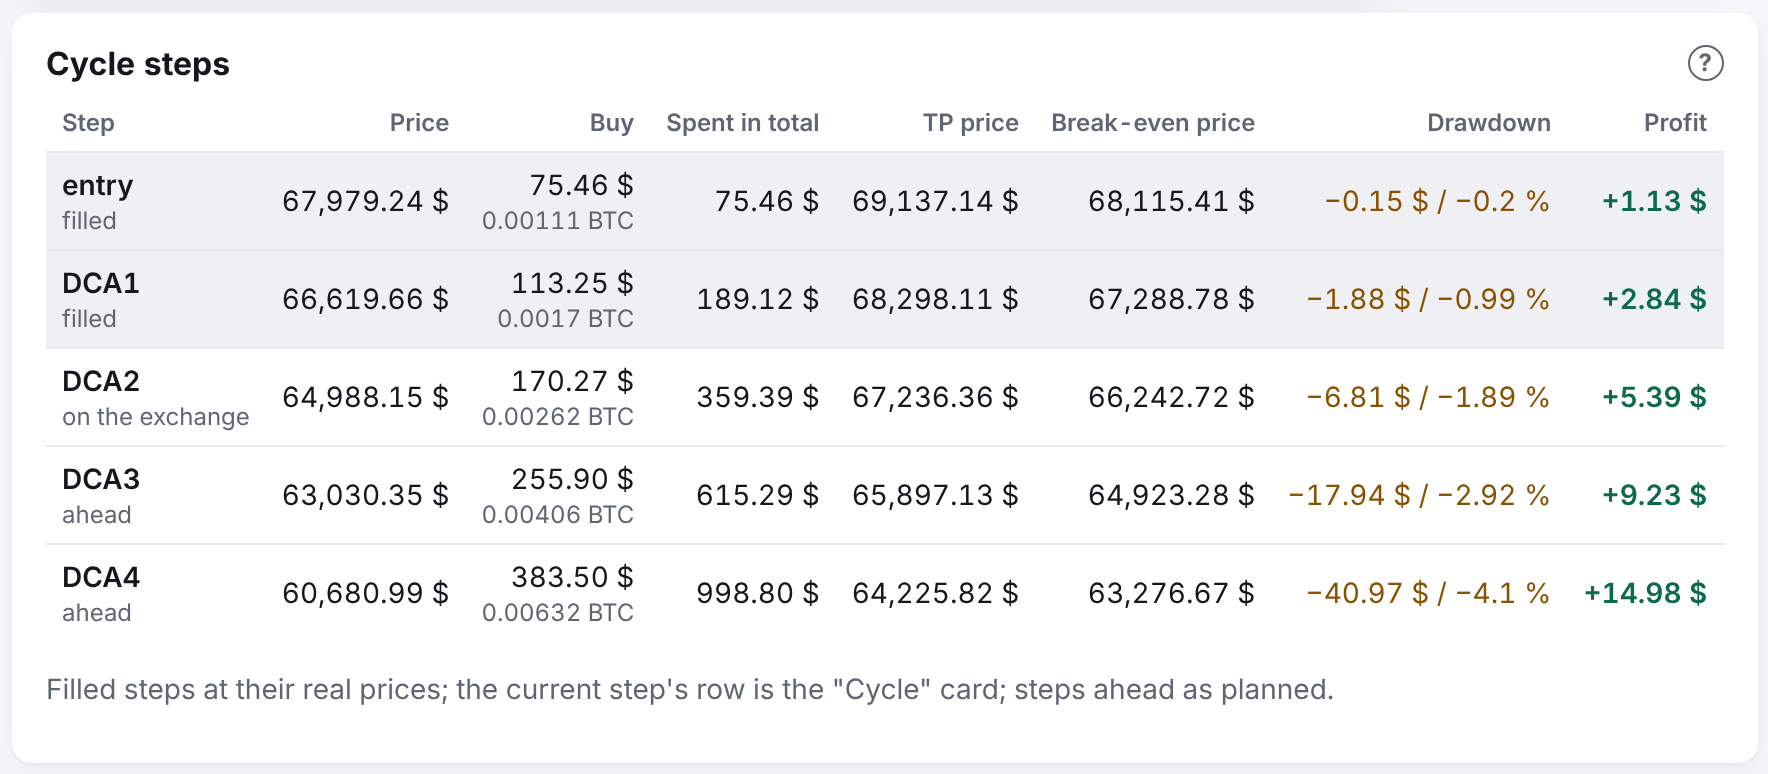
Under the chart — the table "Cycle steps": the same columns as "Settings analysis" when a strategy is created (Price · Buy · Spent in total · TP price · Break-even price · Drawdown · Profit), but for the open cycle. Under each step's name — its state: "filled", "in part", "on the exchange", "ahead"; the rows of the filled steps are tinted. A level you took off in "Manual control" says "taken off by you", one passed over (the exchange would not take such an order) — "passed over": such steps add nothing. Once the TP has begun to fill (any part sold), no averaging follows in this cycle: the steps not bought say "will not come", with the reason in the row, and add nothing either. Until the exchange confirms that a step's order is taken off, the step stays "on the exchange": the order may still fill (the strategy counts its purchase). A step bought in part whose rest is taken off shows in the "Buy" column what was bought, not the step's plan.
Filled steps are counted at their real prices (the entry — at its average), the steps ahead as planned. The row of the step the cycle stands at is the cycle itself: the money spent, the TP and the break-even prices are the ones on the exchange and in the "Cycle" card (with the real fees, manual averagings and your own TP, if set); in the rows ahead — where the strategy moves the TP once the step fills. "Drawdown" is the paper result if the price stands at that step; "Profit" — the cycle's net profit if the price reaches the step and comes back to the TP price. The sums carry the currency's sign: "$" for USDT and USDC, "€", "₽"; COIN-M — in BTC.
Step 3. The price rises: the TP fills
The price reached 59,987.57, the TP filled completely.
| What happened | Numbers |
|---|---|
| TP sell | 0.00517 BTC at 59,987.57 = 310.1357 USDT |
| Fee | 0.3101 USDT (0.1 %) |
| Received | 309.8256 USDT |
| Cost of the part sold | 306.7580 USDT |
| Cycle profit | 3.0676 USDT — 1 % of the cost |
| Remainder | 0.00000482 BTC with a cost of ≈0.286 USDT — less than the minimum order |
The strategy cancels DCA2 and closes the cycle when no order of this cycle is left on the exchange. The remainder — the "dust" — moves to the next cycle together with its cost. It is not part of the cycle's profit.
All the cycle's fees: 0.00000205 BTC + 0.00000313 BTC (about 0.30 USDT at the trade prices) and 0.31 USDT on the sale. They are already counted in the profit: a TP of 1 % is net profit.
In Telegram there is no separate message about the TP fill. One message comes:
💰 Cycle 1 closed
anna1 · BTC/USDT · binance_main

Take-profit filled
Sold: 0.00517 BTC
Sale price: 59,987.57 USDT
For: 310.14 USDT before fees

📈 Profit of the cycle: +3.07 USDT
Last 30 days: +3.07 USDT
All time: +3.07 USDT
Duration: 2 h 15 min
Buys in the cycle: 2
Cycles closed: 1 in 30 days · 1 in all

Nothing to do.
"For" is what the sale brought before the fee. The message rounds sums to the cent; a profit below a cent shows as "+<0.01". The "Duration" here is an example. "Buys in the cycle" is how many entry and averaging orders filled. "Cycles closed" is how many cycles the strategy closed by the TP in 30 days and in all.
In the app the cycle history shows "Profit: +3.07 USDT (+1 %) · +0.31 % to budget"; a tap on the amount shows the exact one: +3.06759219 USDT. The first percentage is counted on all the cycle's purchases (307.044 USDT), including the carried dust: exactly it is 0.9991 %, a little less than 1 %, because the TP of 1 % is counted on the cost of the sold part only; on the screen it is rounded to two decimals. The second is the profit to the budget the cycle ran with (1000 USDT).
Step 4. The next cycle
If "Stop after this cycle" was not clicked, the strategy starts cycle 2 in the same step: it builds a new grid from the current price and enters at market again. The carried dust is counted in the new cycle. On the strategy's screen you see it in the "Carried remainder" line.
If you set new settings, they take effect exactly here, between cycles.
What else the strategy's screen shows
- At the top — the name and the pair, the state mark, the connection and the cycle number, and how fresh the data is: "updated just now" (under 10 seconds), "updated N s ago" or, in red, "no connection" if the strategy has made no step for longer than usual. Usually this is a minute. A strategy in an emergency with no orders of its own on the exchange is checked once a minute, so for it "no connection" comes after two minutes. A stopped strategy with no orders on the exchange is not checked at all — it shows no freshness. The freshness is shown only for a started strategy. If the last step failed, below — "last step: no connection to the exchange".
- A futures strategy has a risk strip under its title, see USD-M futures.
- "Waiting: …" — why the strategy is not placing anything now (for example, "no price", "market closed").
- "Retry … at …" — when the strategy will try again an order that was short of money.
- "Needs attention" — if the strategy needs your attention: the reason and "What to do" (see Needs attention).
- "Closing: waiting for the orders to be cancelled" — after "Start a new cycle", while the exchange has not confirmed that the old cycle's orders are cancelled.
- With an open cycle, right under the title — what matters most: the "Result now" in large type (what closing the position at the current price would give, with its sign, ▲/▼ and percent of the budget), under it "In the position" (the sum and the quantity) and "Next step" — the nearest averaging on the exchange, its distance from the price and its price ("DCA2 · −1.52 %", "at 3,109.33 USDT"). With no averaging on the exchange — "the grid has filled" (and the TP price), "the TP is filling" or "no averaging on the exchange". Below — the cycle's chart.
- The "Controls" block — the buttons "Settings", "History", "Levels", "Average", "TP" in two columns of one width, one "?" for them all beside the block's heading. A stopped strategy has the "Starting" block with "Start" above what matters most. A running strategy's "Stop after this cycle" and "Stop" are at the very end of the screen, in the "Stopping" block. See Managing a strategy and Manual control.
- "Cycle" — the entry price, the average price, the position, the averagings, the TP and the break-even.
- "Strategy's orders" — in three columns: the order and its state, the quantity, the price; the numbers on the right. Under the price — how far the order is from the current price: "−1.52 % from the price". A buy is measured from the sellers' price (ask), a sell from the buyers' price (bid).
- "Settings" — the current settings; "Change" in the card's title. "From the next cycle" — if you set new ones: only the rows that change, e.g. "Budget: 1,000.00 USDT → 1,500.00 USDT". For a T-Invest strategy, once the broker's real fee is known, the "Fee for the TP plan" row has "actual 0.04 %" added beside the 0.3 % (below 1 % — three significant digits: "0.0402 %").
- "Recent cycles" — the strategy's profit with the number of cycles ("Profit · 3 cycles") and a table of the last five cycles: the number and the state, the result with its sign and arrow (▲ green or ▼ red) and, in a column of its own, the percent of the cycle's budget; the numbers are aligned on the right. A tap on a cycle (its number or percent) opens the cycle's screen — its trades, result and settings; a tap on the sum shows its exact value. Under it — the "All cycles (N)" link to the cycle history when more than five cycles are closed.
- A copy's "Settings" show only its own: the market, the mode, the profit currency, the position size and the fee; the parts, the step, the growth, the TP and the entry are in "The leading strategy's rules" above them.
- The "Notifications" card with the switch "Telegram messages about entry, DCA fills and the closed cycle". If you turn it off, there are no "Buy (sell) filled", "Cycle closed" and "Cycle interrupted" messages for this strategy. "Emergencies, faults and missing funds always come." The fill message of your manual order ("Manual N") always comes, whatever the switch.
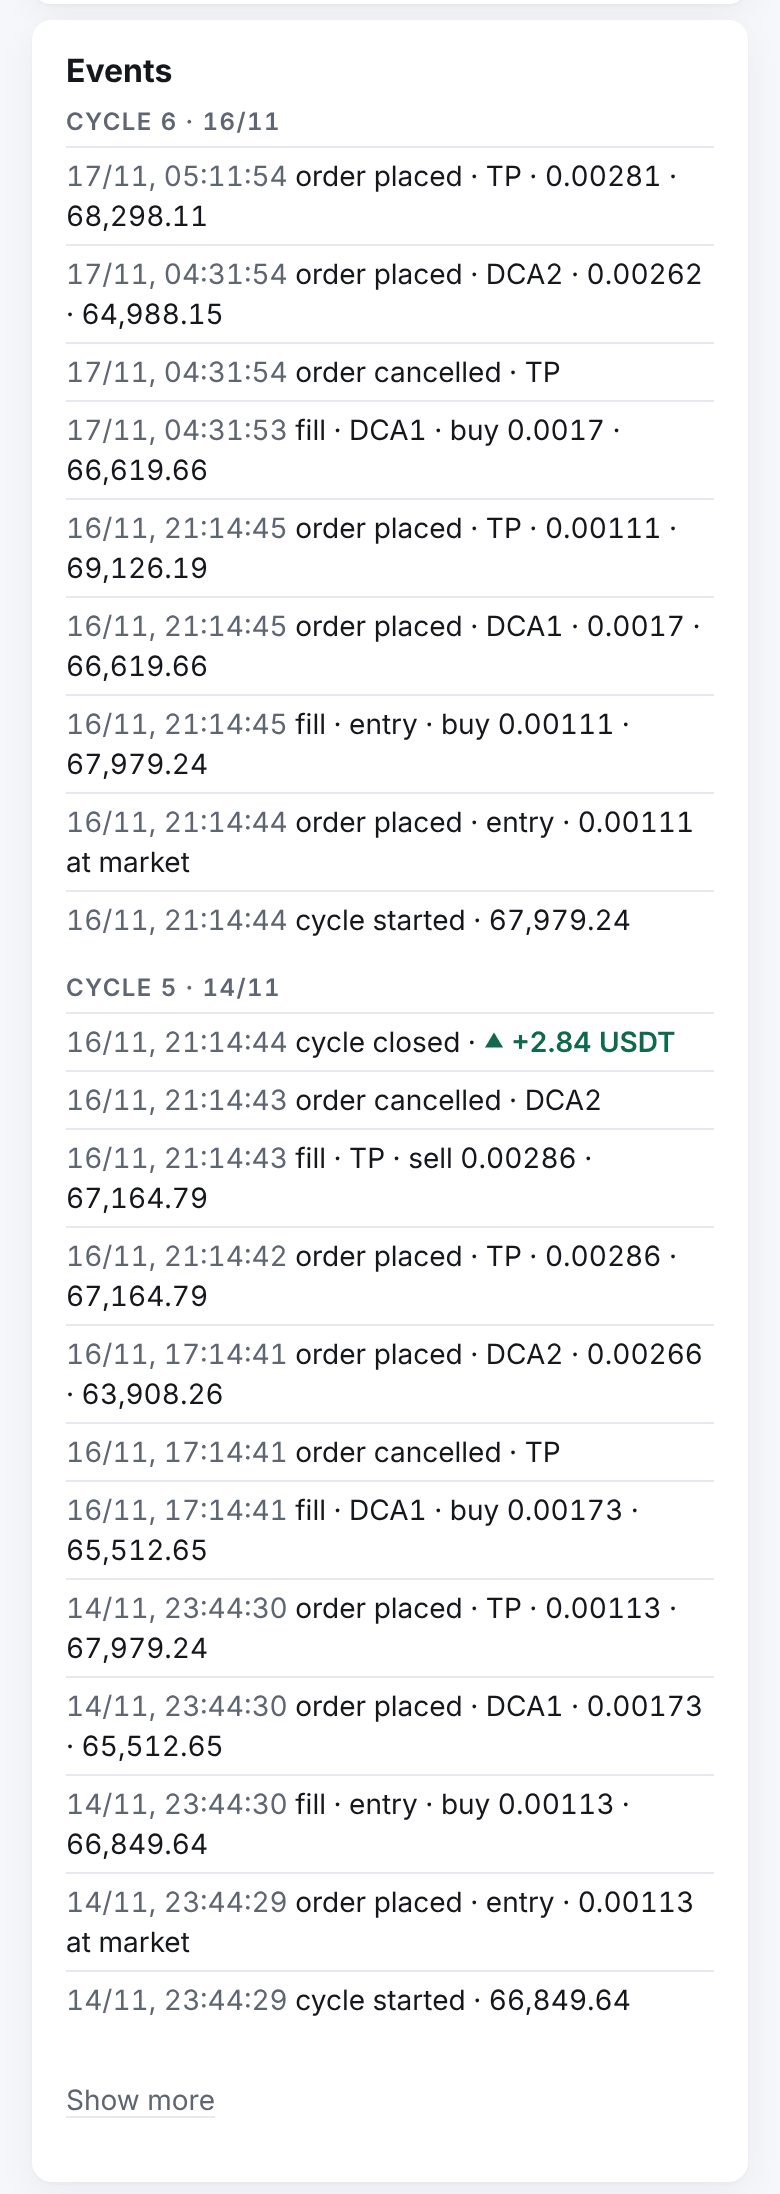
- "Events" — what the strategy did: orders, fills, commands, checks. The events are grouped by cycle: "Cycle 6 · 14.11" over each, the two latest cycles open, the rest behind "Show more"; a closed cycle's result carries its sign and ▲/▼ in the money's colour, as in the list; an order's price stands after its quantity with a dot: "0.0017 · 66,619.66". Commands and changes of the mode are named in words, the numbers as on the rest of the screen: "command · start — a new cycle", "mode · paused", "command · TP at your price 2,900.5", "command · the TP planned with the account's fee 0.1 % from the next cycle". A refusal of the exchange — its reason in words, as in Telegram, and when the strategy tries again: "order refused · DCA2 · the order breaks the exchange's rules (price, quantity or minimum sum) · retry in 5 min", "not enough funds · DCA2 · needs 17,060.40 RUB, free 374,298.95 RUB · retry in 5 min". If the exchange sent a reply, it is added at the end: " · Exchange reply: 101211 The order price is out of range". A manual order the exchange refused by its rules — "the exchange refused the manual order — it is taken off"; a market buy that failed — "the market buy was not made — it is not repeated"; an entry that stays incomplete for 15 minutes — "the entry is only partly filled, no TP is set".
- At the very bottom — "Archive" (for a stopped strategy without orders) and "Download diagnostics (no secrets)" — a file with the strategy's state for the developer.
Next: Managing a strategy