Cycle history and reports
In short
- The history is all cycles of one strategy with their trades; the reports are the profit for a period across all strategies.
- The history is never deleted, even for archived strategies.
- The trades can be exported to CSV.
The history is all the cycles of one strategy with their trades. Reports show the profit for a period by strategy, connection or exchange. The history is never deleted: trades, orders, events and cycles are kept forever, even for archived strategies.
A strategy's cycle history
- Open the strategy's screen.
- Tap "History" in the "Controls" block.
Cycles are listed newest first, in portions; the "Show more" button adds the next ones. Each cycle shows:
- the number and the status: "open", "closed" or "interrupted";
- the start and end time;
- "Entry price" and "DCA filled" (for example, 1 / 3), the number of manual orders;
- "Profit" with its sign and arrow (▲ green or ▼ red), in brackets the percentage of the sum of all the cycle's purchases (for "sell first" — of the sales proceeds), after "·" — the percentage to the budget the cycle ran with ("0.31 % to budget"; with "sell first" on spot with a budget in the coin there is none). A strategy with profit in the coin shows its profit in the coin ("+0.00003681 BTC") — the same figure as the message about the closed cycle and the report; the percentage to the budget is there when the budget is in the coin too. The same in the strategies list, on the strategy's screen and in the "Today" summary (the coin on its own line, never added to money). Because of dust the first percentage is sometimes a little less than the TP you set: the TP is counted on the cost of the sold part only. The amount has two decimals; tap it to see the exact one;
- the mark "needs clarification" if the broker's fee for a trade has not come yet.
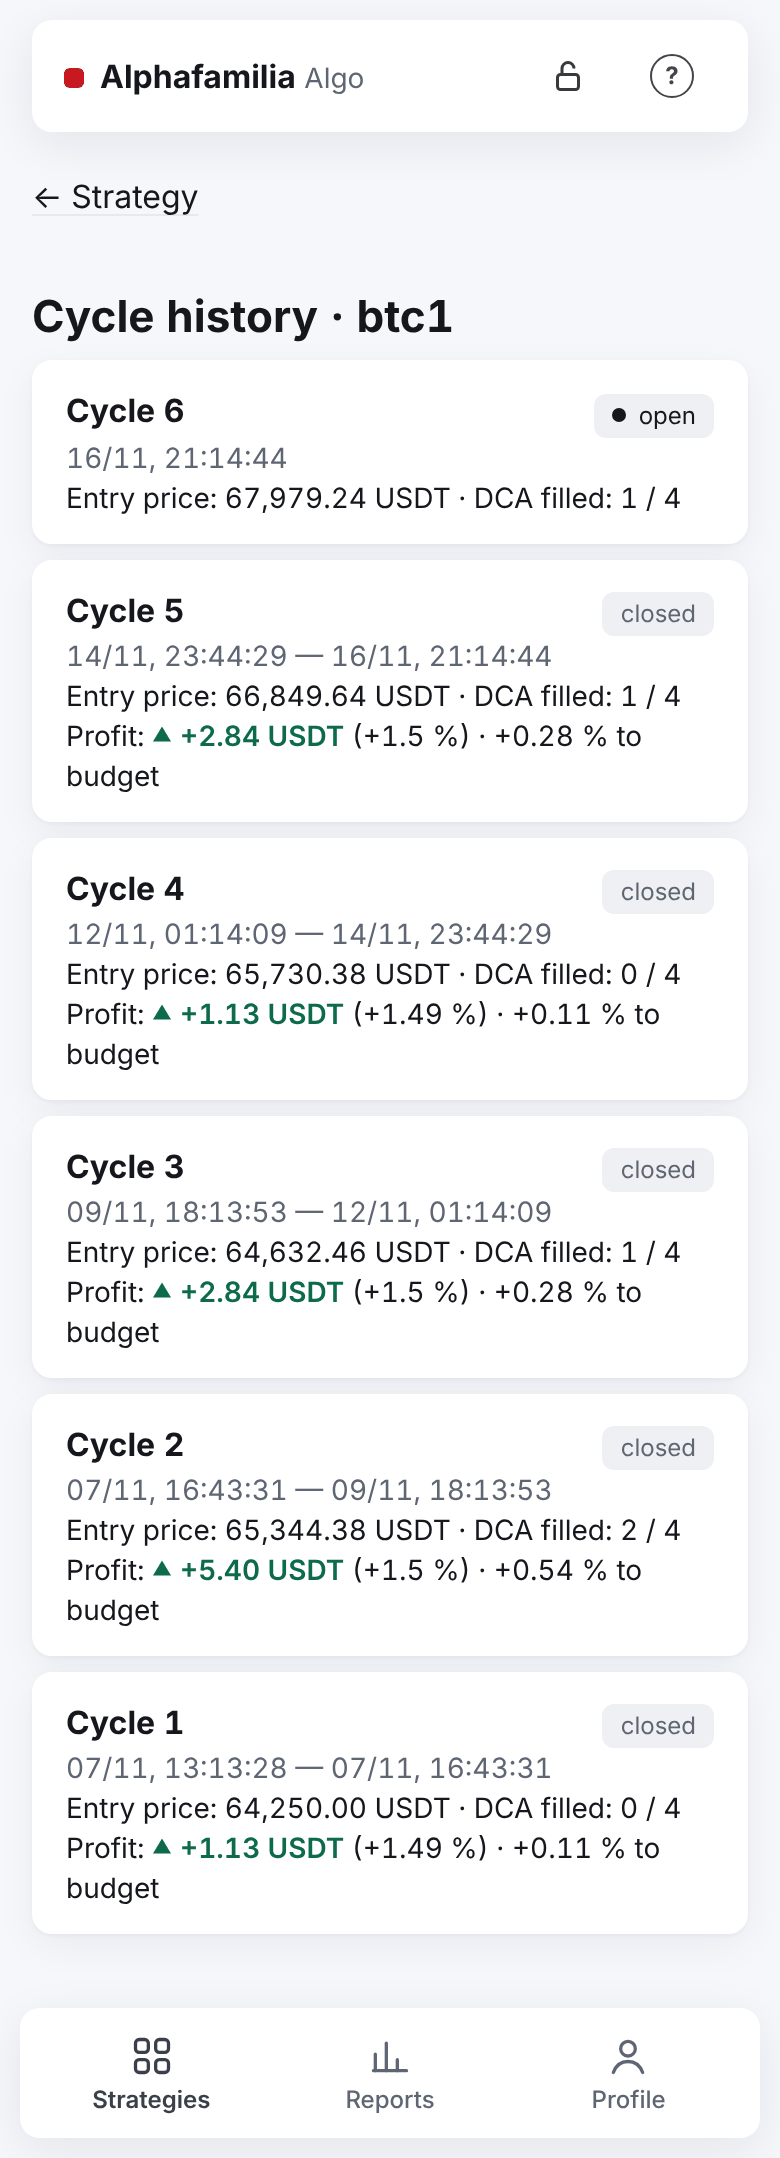
Click a cycle to open it:
- "Status", "Started", "Finished", "Entry price", "DCA filled", "Manual orders", "Profit", "Carried remainder";
- "Trades" — each trade: the time, the role (entry, DCA1, TP, manual), the side, the quantity, the price, the fee and its currency. The mark "not counted in the cycle" means a trade the strategy could not count (see Emergencies and faults);
- "Dividends" — for T-Invest shares: payouts and tax during the cycle. This is your money; it is not part of the strategy's profit;
- "Settings" the cycle ran with.
An interrupted cycle is a cycle closed with "Start a new cycle" or when the strategy was moved to the archive. Its remaining asset is yours: the strategy did not sell it and does not carry it to the next cycle.
Reports
Open the "Reports" tab on the sections' bar at the bottom of the screen (second from the left). The "Reports" title has a "?" sign with a short hint about the whole screen.
- Choose the "Period": "Today", "This month", "All time" or "Custom" with dates. The dates follow your device's time.
- Choose "Group by": "strategy", "connection", "venue" or "all strategies together".
- Choose the "Total currency": USDT, EUR or RUB (the field has a "?").

The order on the screen: first the "All strategies" summary — the total of all your strategies; if you have strategies on both live and test connections — two more summaries under it: "Live trading" (live accounts) and "Demo — test accounts" (test network, demo, VST demo account, sandbox); under it, the rates the "Total" is counted at; then the cards of the chosen grouping (by strategy, connection or venue); at the end, the open cycles. With "all strategies together" there are no grouping cards — only the summary.
In the summary and in each group's card (on a phone each row's name stands over its value, the value on the right). A card shows the profit, the "Total" and "Cycles closed" at once; the turnover, the funding, the duration and the averagings are under "Details". On a wide screen (from 600 px) one table stands in place of the grouping's cards: a strategy (connection, venue) per row, the figures in columns on the right, the cents under one another; the summary and the open cycles stay cards.
| Line | What it means |
|---|---|
| "Profit, USDT", "Profit, RUB", "Profit, BTC"… | Profit in each currency separately — currencies are not mixed. Under the sum, as a small grey line of its own, — "to budget 0.96 %": the profit for the period divided by the budget the period's cycles ran with (not today's: a budget raised later does not change past months; on futures the budget is the position size, not the margin: a 1 % TP gives about 1 % at any leverage), not annualised. In the "All strategies" summary "to budget" has a "?" sign |
| "BTC of COIN-M futures — apart, not in the total · In USD at the close price ≈ … USD" | Under the line "Profit, BTC" if it has COIN-M strategies: their profit in BTC is not converted into the "Total"; USD is for reference, each cycle's result at its close price (COIN-M) |
| "Total in USDT" (or EUR, RUB) | All the profit in the chosen currency at the rates. If some rate is missing — "no rate", not a wrong amount |
| "Turnover, …" | The cost of the cycles' purchases (for "sell first" — the sales proceeds), separately from the profit |
| "Funding (within the profit), USDT" | For futures: how much funding went into the profit of the cycles closed in this period |
| "Cycles closed" | How many cycles were closed and how many were interrupted |
| "Average duration", "DCA fills on average", "Manual orders" | Cycle statistics |
| "needs clarification" | The broker's fee for some trade has not come yet |
How the profit is counted:
- by the cycles closed in this period (by the close date);
- an interrupted cycle adds only what its filled TP part realized; the remainder is yours;
- the carried remainder is not profit;
- funding is part of a cycle's profit: the report counts it with the cycle, in the period the cycle closed, even when it was paid the month before. The CSV lists the same payment by its own date, as Binance's statement does. So while a cycle runs over a month end, the funding of the report and of the CSV for that month differ.
Rates: crypto at the prices of your first live crypto exchange (Binance when it is connected, else BingX, then Bybit and Coinbase; the rates line under the summary says which), the rouble at T-Invest's dollar rate (the dollar is taken as equal to USDT). The euro is taken together with the crypto rates of the same exchange: on Binance from the EURUSDT pair, on Coinbase from USDC-EUR (USDC = 1 dollar); if the exchange has no euro rate, the total in EUR is "no rate". The total in EUR is handy when the strategies' budgets are in euros (Coinbase). The rates are today's, not those of the trades' days. They are read through the exchange keys, so while the vault is locked (or without the needed live connection) "Total" shows "no rate". The rates line is shown only when at least one rate was read: with the vault locked there is none. Without a live crypto exchange but with the rouble rate the line ends with "no crypto rates — a live connection to a crypto exchange is needed". A rate of 1 or more has two decimals ("1 BTC = 66,445.94 USDT"), below 1 — six significant digits ("1 RUB = 0.0108225 USDT"); numbers are written as in the app's language. "DCA fills on average" too ("2.5").
Venues in the grouping: "Binance (spot)", "Binance Futures", "BingX", "BingX futures", "Bybit", "Bybit futures", "Coinbase", "T-Invest".
Open cycles now — for each cycle not yet closed: the result if the position were closed at the current price, and the break-even price. On a phone a cycle is two lines from the left edge: "name · Cycle N", under it "result · Break-even …"; a free line between the cycles. On a wide screen — a table: "Strategy", "Cycle", "Result now", "Break-even", the numbers on the right. The strategy's screen shows the same — "Result now" and "Break-even".
Export trades to CSV
- Choose the period on the "Reports" tab.
- Click "Export the period's trades (CSV)".
- Open the file in Excel.
The file has all the trades of the period with exact numbers. Columns: "Date", "Strategy", "Pair", "Side", "Price", "Quantity", "Amount", "Fee", "Fee asset", "Cycle", "Order", "Counted", "Trade id". Futures funding payments come as lines with the role "funding — by the payment date; in the report — in the period the cycle closed".
The file is made for a Russian Excel: the separator is ";" and the decimal separator is a comma — in the English app too.
The file is named by the period's first day: fills-2026-11-01.csv; for "all time" — by the day of the export: fills-all-2026-11-01.csv.
At most 100,000 trades are exported at a time. If there are more, the app says "Too many trades — choose a shorter period.".
"Needs clarification"
The T-Invest broker sometimes sends the fee later than the trade. The strategy counts it once, when it comes. If the cycle closed earlier, its result is marked "needs clarification" until the fee comes. The late fee is shown in the cycle's history.
For futures, the same mark appears when the strategy could not work out its share of a funding payment. See USD-M futures.
Next: Emergencies and faults